Barry, in his post Monday, chose to shift the UST data to the left for comparison. I reproduce this below using my data. The chart extends further to the left including the data leading up to the Japanese stock market top.
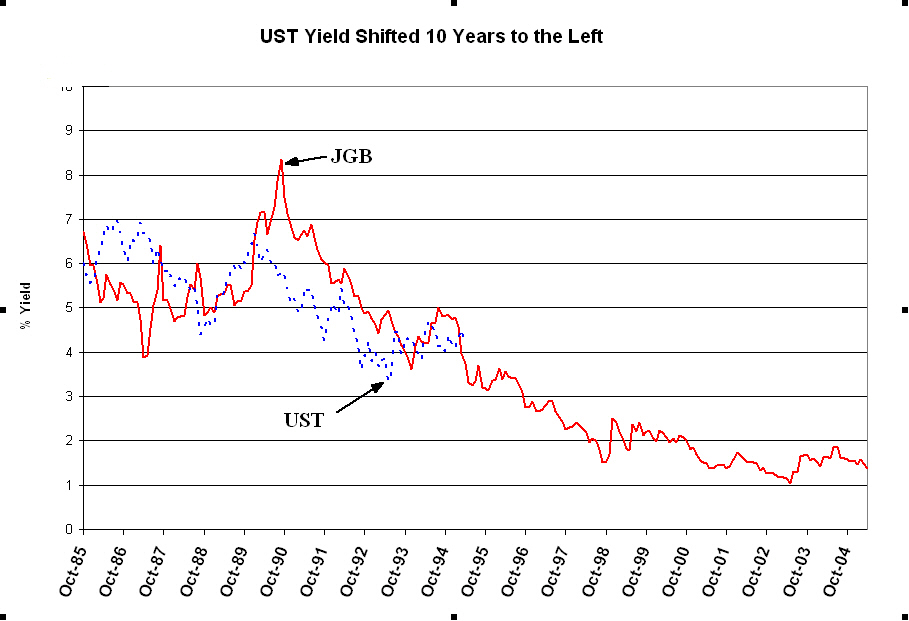
It matches up pretty good, but both series have been in downtrends for the last 15 years so several sideways shifts will appear highly correlated over a 5 year period.
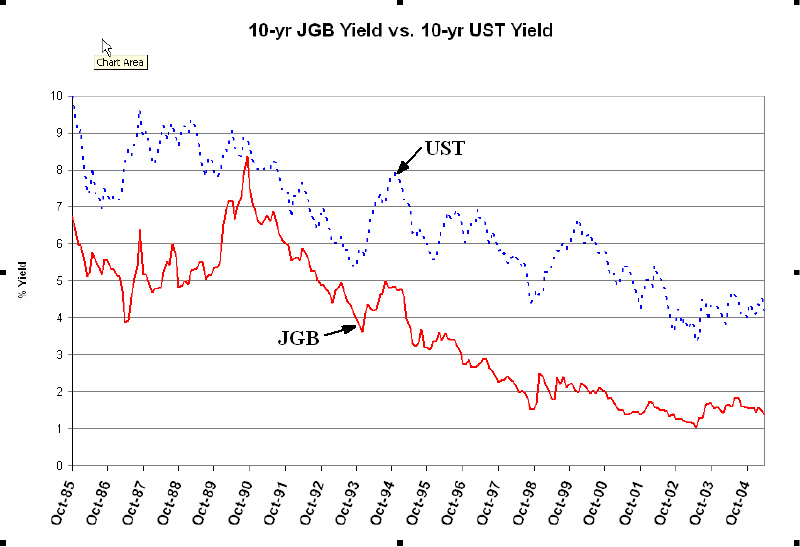
The argument I attempted yesterday was that the two series are already a good fit without any lag. I represent my view below by offsetting UST yields lower by 3%. This vertical shift lays the two data series on top of each other for visual effect.

It looks like a pretty good fit for the last 20 years. Lots of peaks and troughs line up. Notice that the last two years line up in uptrends similar to Barry's graph. The need for a 3% shift might be explained by the savings differential between the US and Japan. Probably an oversimplification but not entirely unreasonable.
The two shifted charts lead to different implications for the future. If the downtrend in JGB yields has reversed I would not expect US rates to continue lower. I would not even expect US yields to be weighed down by some sort of structural damage left over from the 1999 stock market top. I would instead expect them to continue tracking JGB yields and head higher.
Wouldn't it make more sense to remove the time trends from these datasets, either using a set of time dummies or a linear trend? Just a thought.
ReplyDeleteTime series analysis is not really my area of expertise. I just wanted to show my reasons for doubting that U.S. rates will follow Japan's trends from the 90's.
ReplyDeleteA next step that I considered was looking at whether JGB rates in the 90's were doing an equally good job at predicting current JGB rates as they were predicting current UST rates. I didn't do this because I believe that JGB rates have bottomed and any lagged relationship would be coincidence.
Mabye I am misunderstanding what you mean by "time trends" but since I don't believe the downtrend is a permanent feature and with the basic patterns in the both the lagged and unlagged charts looking the same I am not sure what removing the trend would reveal. Maybe that is just my lack of experience in making these types of comparisons though.