Showing posts with label Technical analysis. Show all posts

May 27, 2010

Technical Analysis 101: Adam and Eve

I got bullish a bit early on equities last week as the Euro bounced and it felt like panic was in the air on the day of the German trading bans.  Still the pattern in stocks looks constructive for the short-term with a target above S&P 1150 (SPY 115).


The chart for SPY bears a striking resemblance to a double bottom pattern with momentum ebbing as the panic low from two weeks back gets retested.   Also, as Bill Luby points out options traders seem to be getting ahead of themselves pricing implied volatility trading above what is being observed.

I am only playing through upstrike call options (where implied vol is less dear), so my downside is limited.  Momentum players may still have stocks to dump so I have positioned for a bounce but kept the risk low.

If we do manage a rally here it is easy to imagine the news coverage shifting to discussing the liquidity enema eminating from central banks as equity positive.

Jun 16, 2005

Morning thought

I think that higher open in Newmont (NEM) completes both a head and shoulders break, and an island reversal (updated 2PM - on further inspection the gap open did not clear the high of 39 from 4/27). It also looks a lot like the pattern in Phelps Dodge (PD).

Contrahour runs down the bull and bear views this AM. For bear support he also looks to transports but he sees the banks as central to the bull case. I would add to the bull side that with the yen joining in dollar weakness this AM, last week's bond weakness, and renewed commodity strength we are basically seeing a resumption of the trends from Spring '03.

Not quite convinced it will happen but yesterday's reversal to the upside certainly keeps it on the table.

Jan 7, 2005

A Chart for Tomorrow

MDC raised its earnings guidance tonight. Stories like this flash by all the time but on this one I poped up a chart to take a look at it. It has not participated in the New Year's correction to any great degree and appears well poised to make new highs in the first hour of trading tomorrow.

I don't know anything about the stock but that is just my first guess from seeing the chart and the news. Obviously all the real geniuses bought it today. If you are not among them it is probably still goood for entertainment value.


Posted by Hello


Click on the chart to see a larger image!!

And while I am on. The breadth had been kind of crap all through December so with yesterday's performance we have managed to set a pretty low bar. It would not take much now for the breadth to actually begin improving even if the indices make a new low. Check out the oscillator to see what I mean.

Dec 29, 2004

Still Awake

Charts posted with Hello

Click on a chart to see a larger image!!


MMM looks like it will soon join the likes of GE and TYC in their uptrends. It is still below resistance but having cleared its 200 day moving average it appears to be carving out a near-term bottom.


SYNM also looks like it will soon be reaching for new highs. Has a nice tight risk-reward ratio while it holds above the recent gap.

Overall I expect the beginning of next week to be strong. Maybe some risk that we get a delayed negative reaction to the tsunami but seasonality and a well-rested uptrend should win the day. The semiconductors may be a good long in here as they are due for some rotating capital. I mentioned some head and shoulders patterns in AMAT and KLAC a couple weeks ago but the necklines have not been violated. The failure of that pattern might have left shorts squeezable.

Nov 16, 2004

Sterling! Cable! Pound!


Posted by Hello

The dollar is finally getting a feeble bounce but I continue to believe shorting GBP/JPY is a better trade for the long run. I think it will break the support around 194 shortly and test the Mar lows after that. The world's growth is going to be centered in Asia and British interest rates are peaking. These factors could make this trade even more attractive than USD shorts.

What's on your plate?

All charts posted with HelloPosted by Hello


The chart of Intstinet demonstrates the renewed belief in retail trading. The pattern is also reflected in TRAD (Tradestation). They are good charts but I think it is a Texas hedge for people who make their living in the financial industry already.


This chart also looks like it has lots of upside.

Nov 15, 2004

My kind of Chart


All charts posted with Hello! Posted by Hello

These two charts are both the kind of patterns I am looking for in this market. The market as a whole is overbought and needs a breather. That breather may turn into a pullback that reaches the 200 day and shakes out some longs that got in late. To avoid being one of those longs I am focusing on stocks with nice patterns that have not rallied with the market but are beginning to show signs of interest. There are a lot of stocks like these out there and I plan to just keep scanning and scaling into a couple of positions a day.

Nov 9, 2004

Charts for thought

All Charts posted with Hello.


Really not too much stood out in today's action. I flagged these three charts because they all show the beginnings of a breakout from a reasonably long base. More importantly is that all three of them are Chinese stocks. One is a manufacturing stock but the other two are telecoms. I generally like playing strength or weakness across whole sectors and while 3 stocks is really the bare minimum to indicate something is afoot I thought I would point it out. The patterns are all close to support giving a generally low risk entry.

Nov 7, 2004

Chart Catch up

All charts posted with Hello Posted by Hello


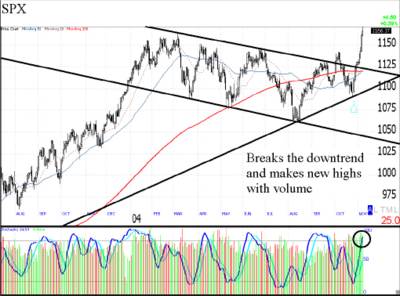
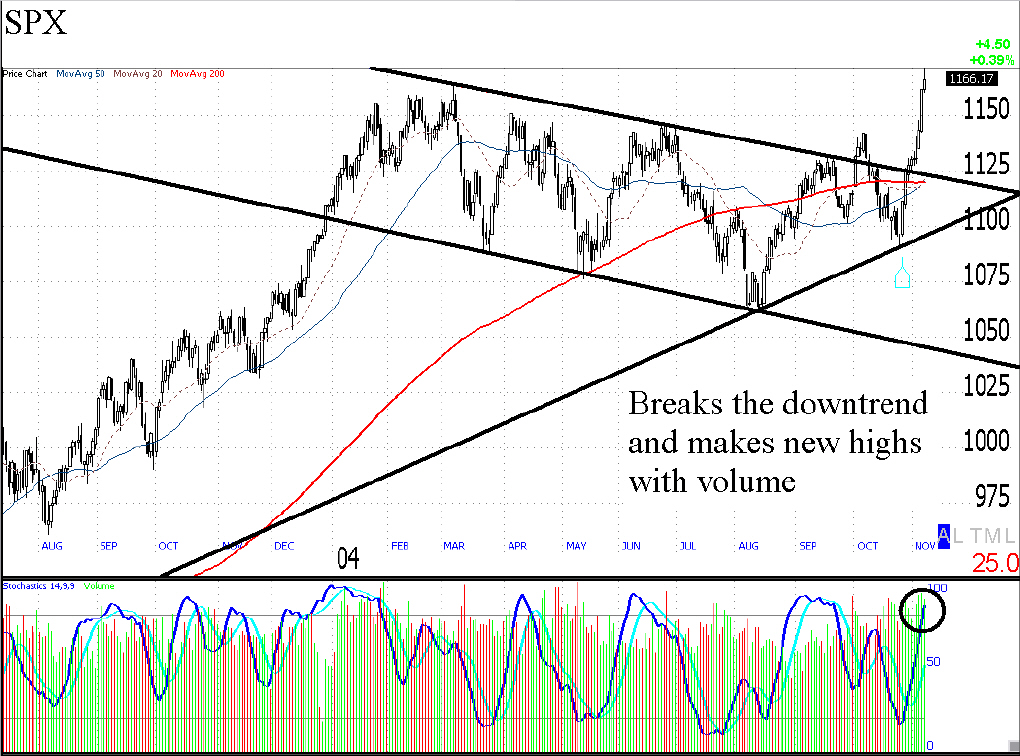
The story of the week is the breakout in all the major U.S. equity indices. While I do think that over time the economic numbers will justify the equity advance, I would expect the uptrend to look a lot like the downtrend we just went through. The SPX made new lows three times this year and each proved to be a short-term buying opportunity. I would expect some short-term consolidation here that eventually gives way to weakness. From here it looks like the 200 day moving average will be a buying point.


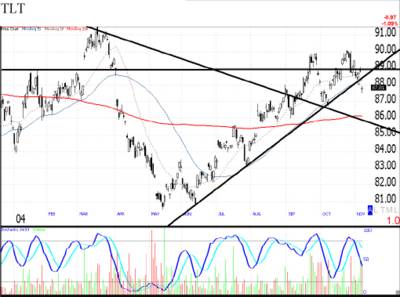
I mentioned the TLT chart on Thursday and Friday's unemployment data did indeed lead to a trendline break. I prefer betting on economic strength in the near-term by shorting treasuries. The move in yields is near its beginning while the stock market has probably overshot in the short-term. I have a position in TLT puts.


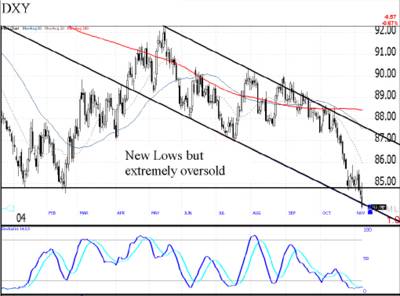
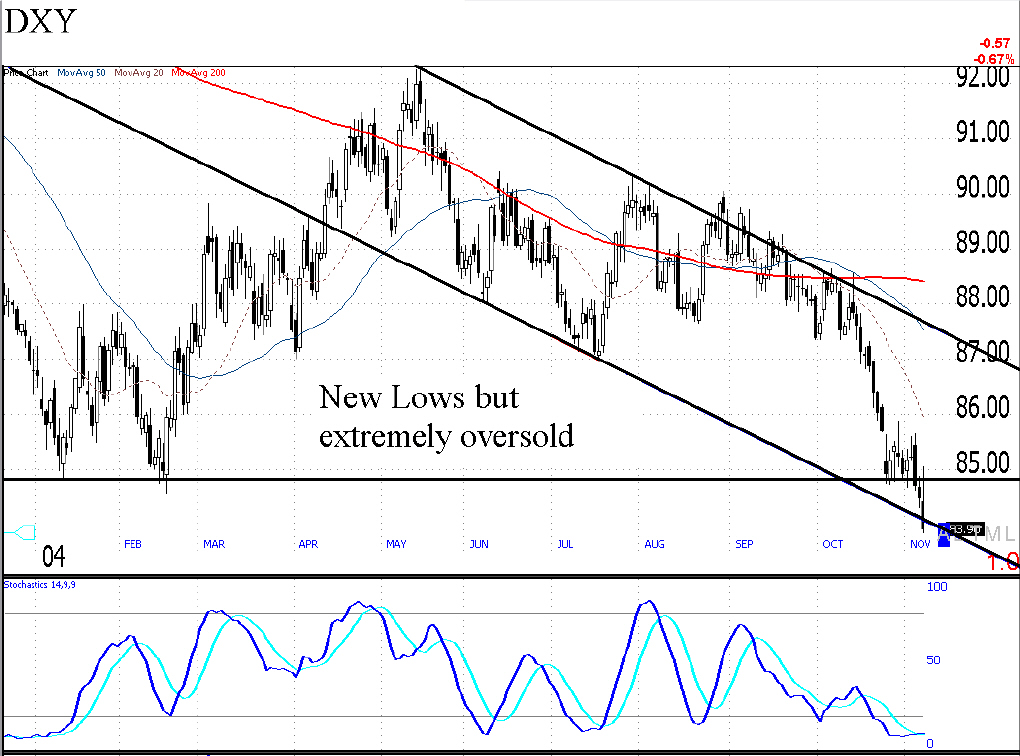
I have decided to stick to my guns on a dollar bounce. I think the sell off on Friday on good economic news is really the equivalent of the patient being pronounced dead. As I once heard Art Cashin say "Just when the patient is declared dead, he jumps up off the table." Those deeply oversold stochastics flatlining across the bottom should provide a powerful snapback in the event of a rally. Hopefully we will get an inside day (or a couple) to create some short-term stop loss points and allow an entry.

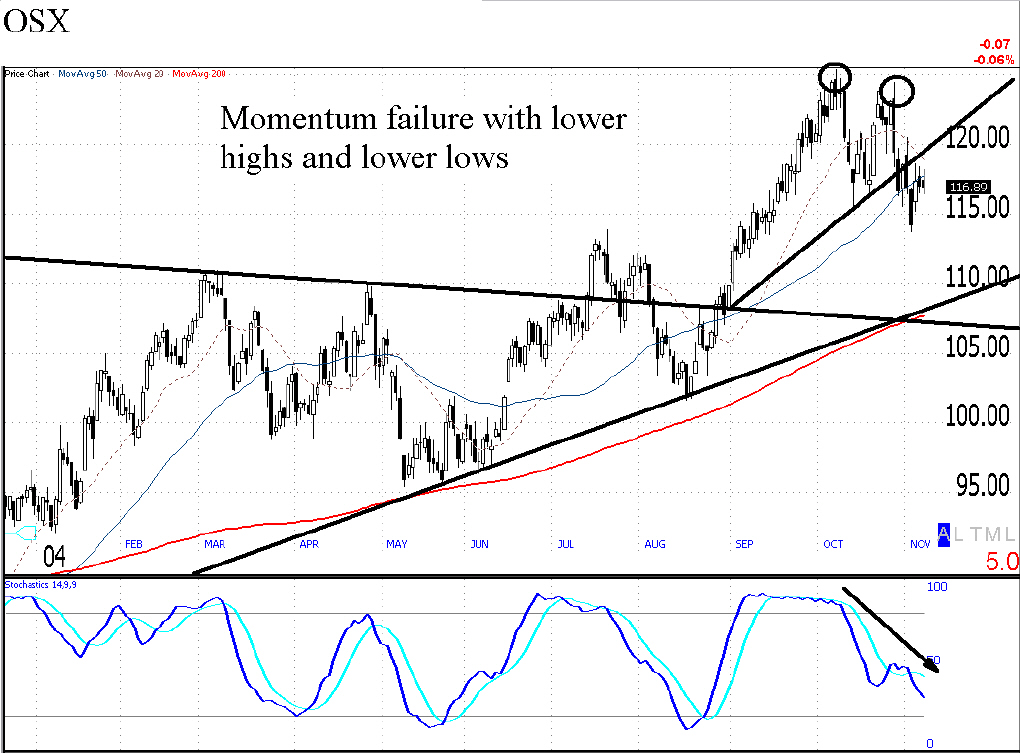
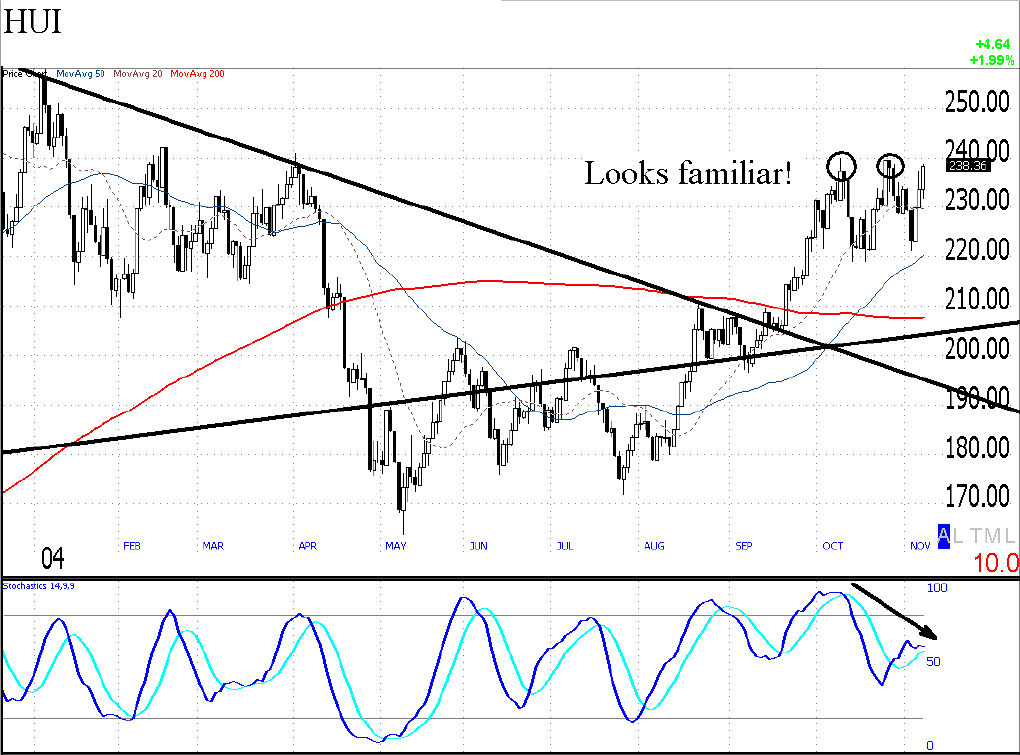
Part of my opinion on the dollar stems from the following commodity charts:


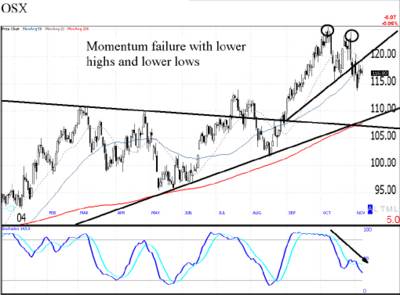
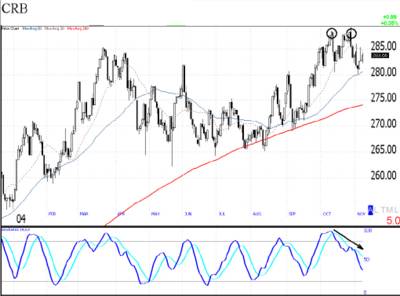
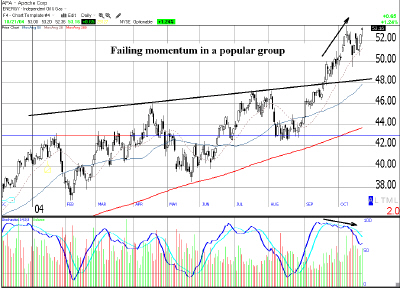
I believe oil makes up 15% of the CRB index but even so I think it says something that the equities and their underlying commodities all seem to be showing flagging momentum. No doubt about it that oil was the talk of the town a couple of weeks back and highs made in such circumstances are usually meaningful. I am , however, a bit surprised to see what looks like weakness in the entire CRB and particularly the metal stocks. Gold stocks in particular appear to be anticipating some metal weakness by not following the yellow metal to new highs. In this sector shorting oil and oil stocks makes the most sense but a dollar rally could be surprisingly painful for metal longs.

Oct 21, 2004

Charts for thought.


Posted by Hello

This is a chart of the oil driller APA (Apache). It has had a great run but appears to be forming a short term double top. Time will tell but it should get some good support around 48. Be patient if you plan to buy as momentum seems to be failing particularity hard these days.


Posted by Hello

FDX (Fedex) looks ready to head higher.


Posted by Hello

The trendline from way back is pretty powerful stuff but there does not seem to be very much follow through on the break. It looks like C (Citigroup)will need to test the trendline from beneath. I will reevaluate it if it does.

So that was an oil stock ready to pull back, a transport leader set to continue its momentum and a bank that seems overdone on the downside. I probably need to own a few more longs here as these are all bullish implications.

No positions in any of the stocks mentioned.

Oct 19, 2004

Is Google eating their lunch??


Perhaps a short looming here. This is a volatile stock so a smaller position and wider stop may be necessary to participate. Posted by Hello

Oct 17, 2004

Dollar Index (DXY) in the Hotseat!!


DXY staying below the downtrend and breaking below nearterm support. Posted by Hello